Introduction
Performance is often times an afterthought when it comes to Software Development and DevOps, kind of like how security is. No one seems to consider or care about it until suddenly everything’s too slow and taking forever to work.
More often than not, performance can be boiled down to I/O since storage is frequently the weakest link in the chain. Understanding how I/O works and possible options to fine-tune it can make wonders on your infrastructure. This is exactly what we’ll be discussing in this post today.
We’ll be going over the basics of I/O benchmarking and trying to emulate various workloads while using the open source tool fio, short for Flexible I/O tester.
Setup
Luckily we don’t need a fancy or complicated setup to do our benchmarking. All we need is:
- One Linux VM with a distro of your choice. Personally I use Ubuntu 24.04 LTS.
- An HDD volume attached to the VM.
fiofor I/O benchmarking.
You can run the commands below to set up and mount your volume:
| |
Journaling and existing I/O workloads will affect the benchmark. So make sure to run on a clean system to get accurate measures
Installation
FIO can be installed using the package manager. Check the documentation for your own distro. In my case, it’ll be Ubuntu. So the installation is done using the command:
| |
FIO Overview
This section will focus mainly on high-level concept explanation. The technical, nitty-gritty details will come after.
fio has an overwhelming number of parameters to simulate all sorts of workloads. We’ll be focusing on a handful of key ones that are enough to cover most scenarios:
bs: block sizesize: File size to read/write fromiodepth: Queue size for I/O submissionsnumjobs: Number of processes to create and perform the I/O operationsrw: Type of the I/O operation to perform suchread,write,rwetc. Check the documentation for further options.runtime: The duration to perform the I/O testdirect: Boolean attribute, true if it’s set to1and0otherwise.ioengine: Two most common engines areio_uringandlibaio.output-format: Defaults to shell-based format.jsonis recommended for parsing and automated processing.
fio runs in one of two modes. Size-based, until the
sizeis reached. Time-based, until theruntimeis exhausted. I’d recommend to set one, not both.
numjobs vs iodepth
This is a common point of confusion and can be misleading, often leading to very different results. In short:
numjobscontrols the process-level parallelism meaning,fiowould spawn and create different dedicated processes to perform the I/O task.iodepthcontrols the queue size, or, depth, at the job level
The total number of maximum in-flight I/O requests is numjobs * iodepth.
Block size
Setting the correct and proper block size is tricky. It can mess the entire benchmark and give a false impression. Block size can be split into two broad categories:
- Small block size: Typically 4k up to 16k in size. Useful for random I/O and database/transactional workloads. AWS uses 4k block size by default for their EBS service
- Mid-range block size: Typically 16k up to 64k and is used for mixed workloads. MS SQL Server uses 64k block size by default
- Large block size: 128k and up to 4M. Recommended for sequential reads, backups and data warehousing. AWS Redshift uses 1M block size
Each application has its own requirements and the I/O has to be fine-tuned for the workload
itself. A good rule of thumb is to use 4k, 64k and 1M for small, middle and large block sizes respectively.
ioengine
libaio, which stands for Library Asynchronous I/O, used to be the default I/O engine on Linux. It’s not completely
deprecated, since it’s still the recommended I/O engine for testing HDD storage and legacy async I/O behavior.
io_uring would be the go-to for SSD and NVMe type storage.
FIO supports plenty of engines, including sync for synchronous I/O, mmap, windowsaio and plenty more. You can find
the full list from the documentation.
Always read the documentation when choosing an engine, not all parameters are compatible with every engine.
direct vs non-direct I/O
Direct I/O means that the I/O goes directly to the disk and bypasses any OS/page cache, hence the name. Non-direct I/O, on the other hand, can be considered as buffered-I/O. Meaning that I/O operations are collected together, in a buffer ( OS page cache), and then written (or read) at the same time. Buffered I/O will almost always be faster than non-buffered I/O, though it’s not a fair comparison since they perform different things and serve different purposes. The natural question then becomes, when to use which? Use Direct I/O to test the raw hardware storage performance and non-direct I/O for testing your RAM and caching system.
To sum things up, as a rule of thumb:
- Use
direct=1when benchmarking storage hardware - Use
direct=0when benchmarking the cache system
HDD vs SSD Considerations
Different storage types behave very differently, so tuning fio parameters for HDDs and SSDs is important. HDDs, being
mechanical, are latency-bound and benefit from low queue depths and single-job workloads (
numjobs=1). Random reads/writes are slow, so small blocks (4k) are used for testing database-like workloads, while
sequential tests can use larger blocks (1M) and are useful for user applications/workloads.
SSDs, on the other hand, are throughput-bound, handle high parallelism very well, and can achieve maximum performance with higher iodepth and multiple jobs. block sizes also vary depending on the workload that we’re trying to simulate.
Tuning numjobs, iodepth, and bs parameters according to the storage type is critical to ensure the benchmarks
reflect the device’s true performance to avoid erroneous conclusions.
A good rule of thumb:
| Storage Type | Recommended numjobs | Recommended iodepth | Typical bs | I/O Engine |
|---|---|---|---|---|
| HDD | 1 | 1–8 | 4k (small) / 1M (large) | libaio |
| SSD / NVMe | 4–16+ | 16–64+ | 4k–128k (random) / 1M+ (sequential) | io_uring |
Our First FIO Command
We’re finally ready to test our first real FIO command after having built up a lot of background info and knowledge:
| |
The command above basically spawns a single process to do a read I/O at /mnt/dev/ directory using the libaio
engine with a block size set to 1M. The process will perform O_DIRECT I/O operations (--direct=1) to avoid the
cache, and it will do so for a total of 30 seconds. Having specified the --directory, fio will create
the file for us and perform the task. Finally, when the process finishes, we get a summary of the output:
| |
Some of the output has been removed for maintaining brevity.
Key metrics to focus on are mainly:
lat: LatencyBW: Bandwidthiops: Number of I/O operations per second
Parameter Comparison
We’ve mentioned earlier the difference between direct and non-direct, big block size and small block size. So let’s see it in practice.
All commands and tests are done on the same machine to get accurate and consistent results
Small Block size vs Large Block size
We’ll be using this base command:
| |
Let’s start with bs=4k, we get:
| |
And now with bs=1M, we get:
| |
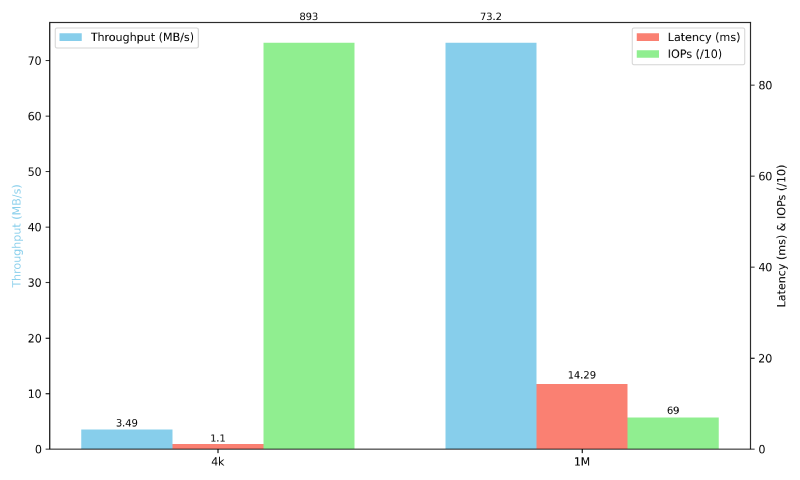
We have the plot below (generated using Python’s matplot lib) to better summarize and visualize the results:
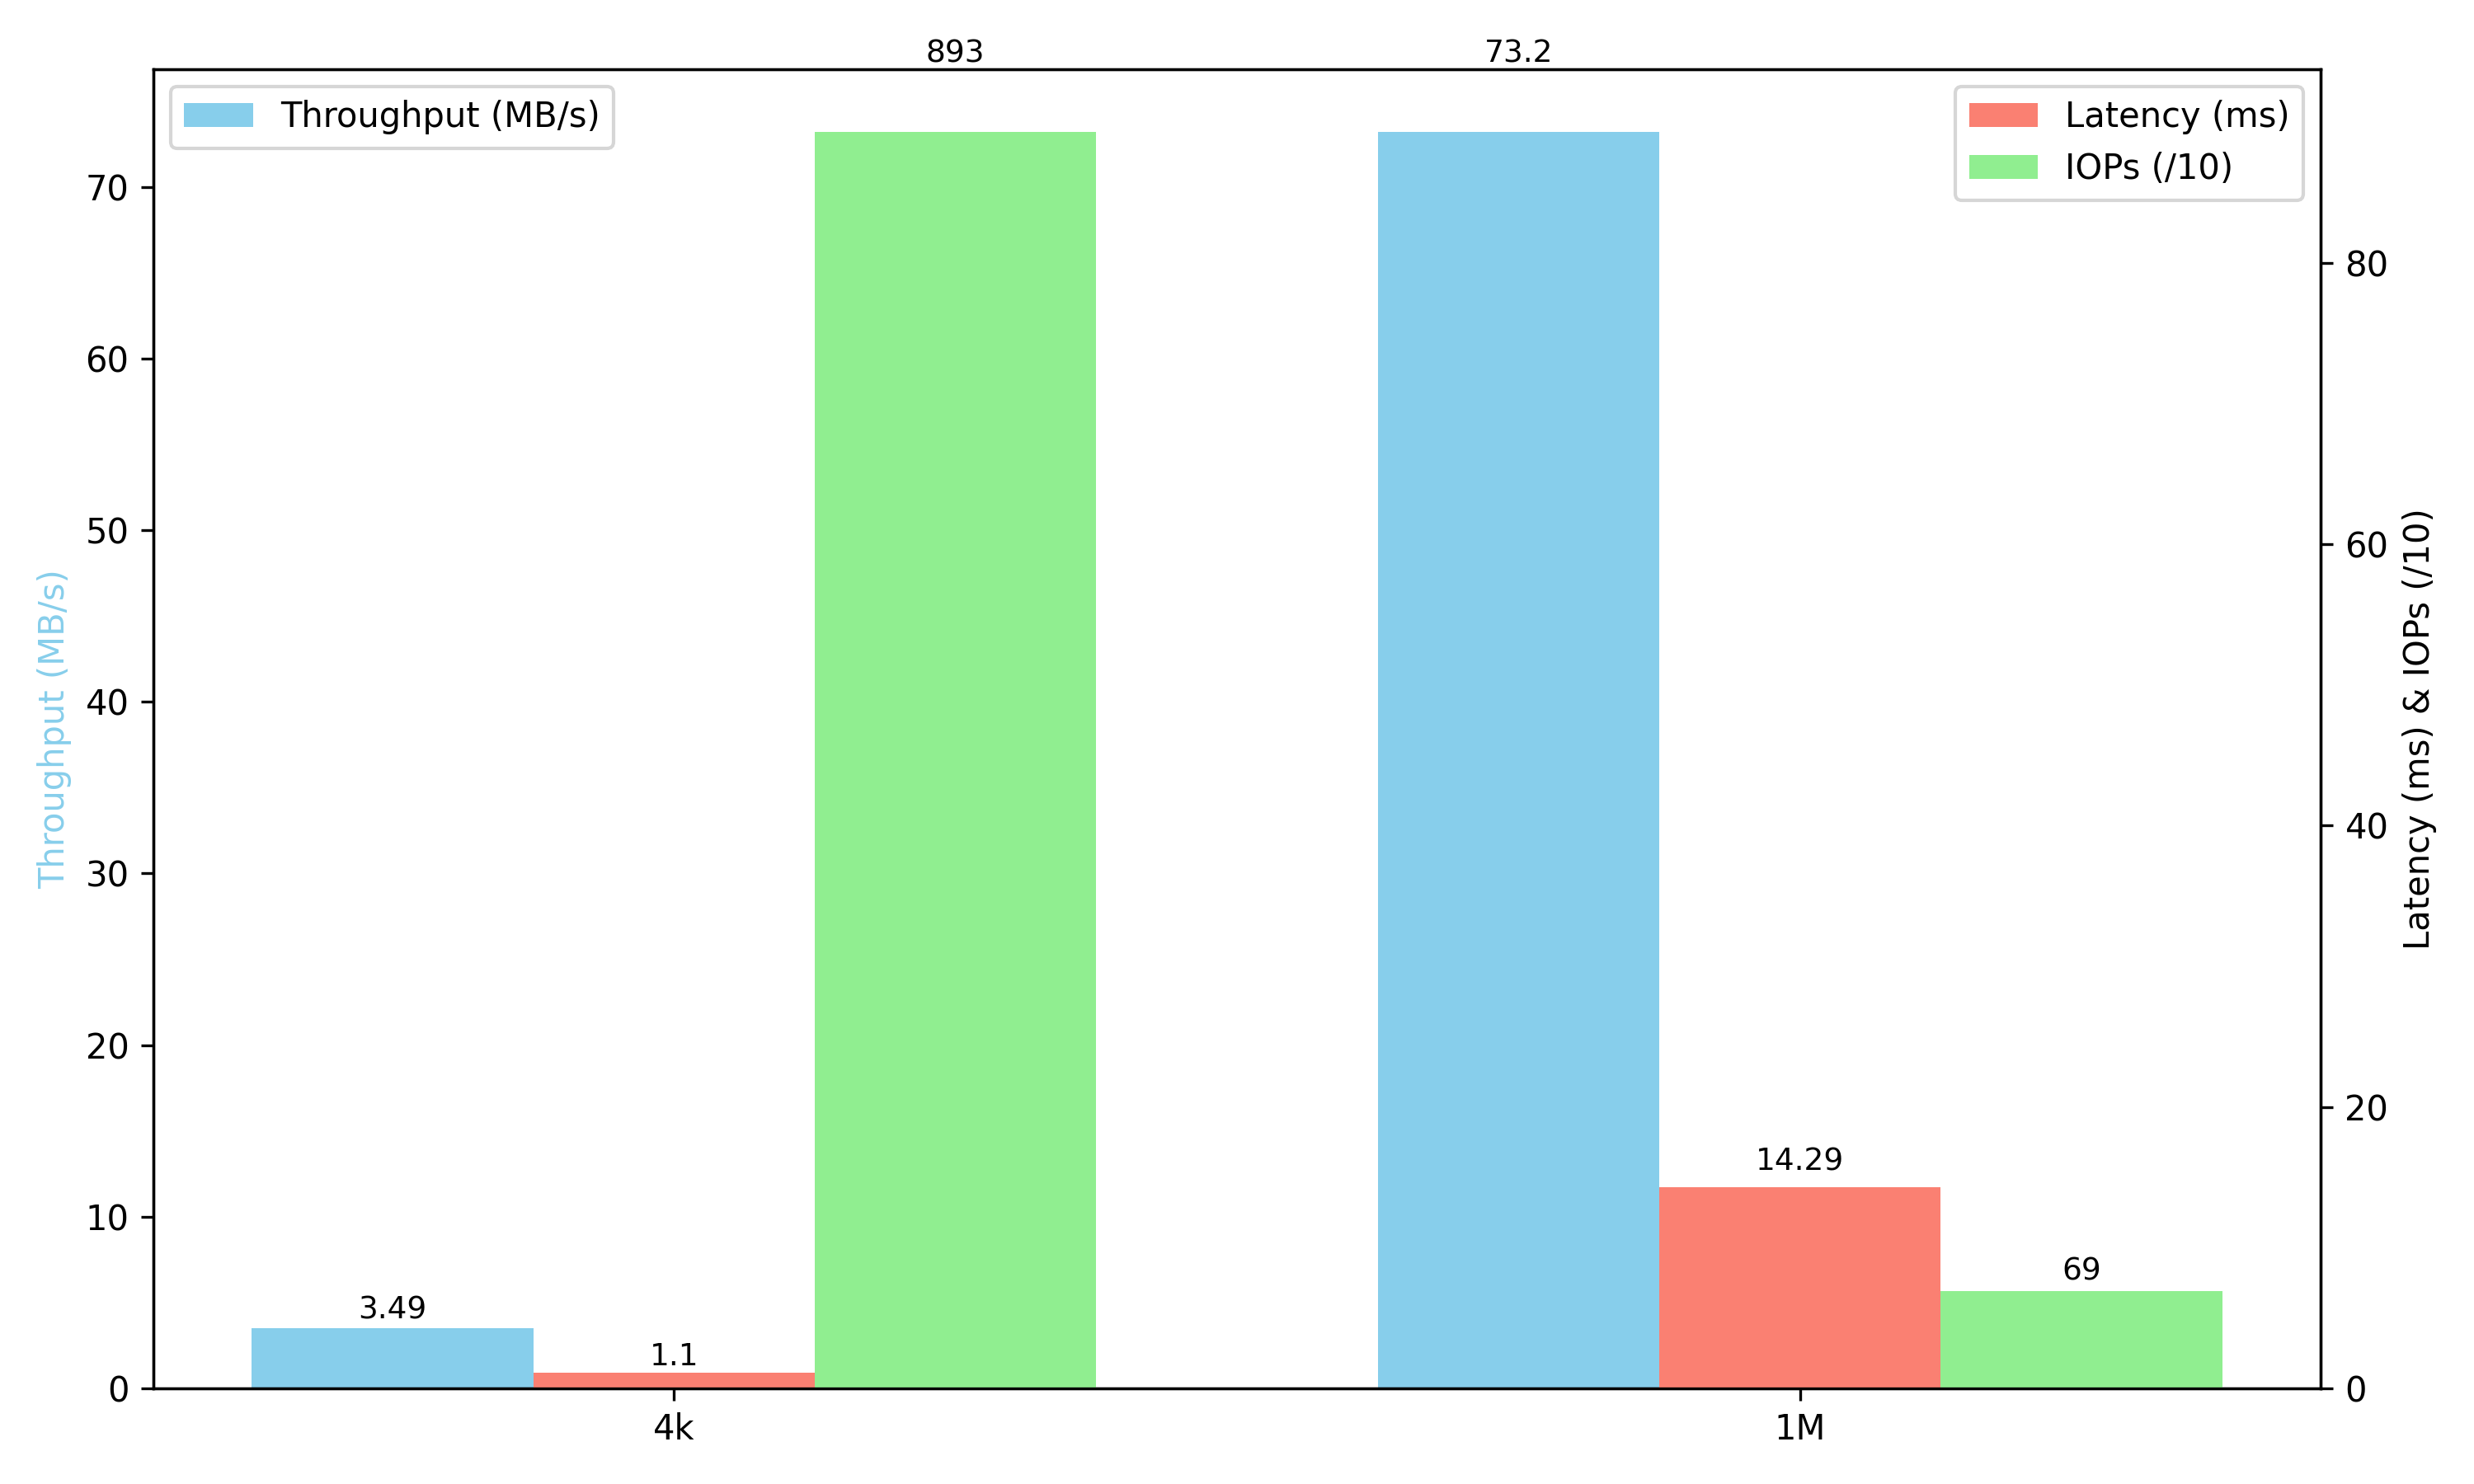
We can notice a pattern. The 4k block size has:
- Low throughput (an impressive 3.49 MB/s)
- Low latency
- High IOPs
While the 1M block size is the complete opposite:
- High throughput
- High latency
- Low IOPs
Direct vs Non-Direct
Now let’s see the difference with the direct parameter. Just as before, we’ll use this base command:
| |
It’s important to run both tests with the SAME block size to get as accurate of a comparison as possible
First, we’ll test direct=1 (same as the command in the earlier section):
| |
Now running with direct=0 and we get:
| |
Let’s plot the comparison just like before and see:
We have the following comparison:
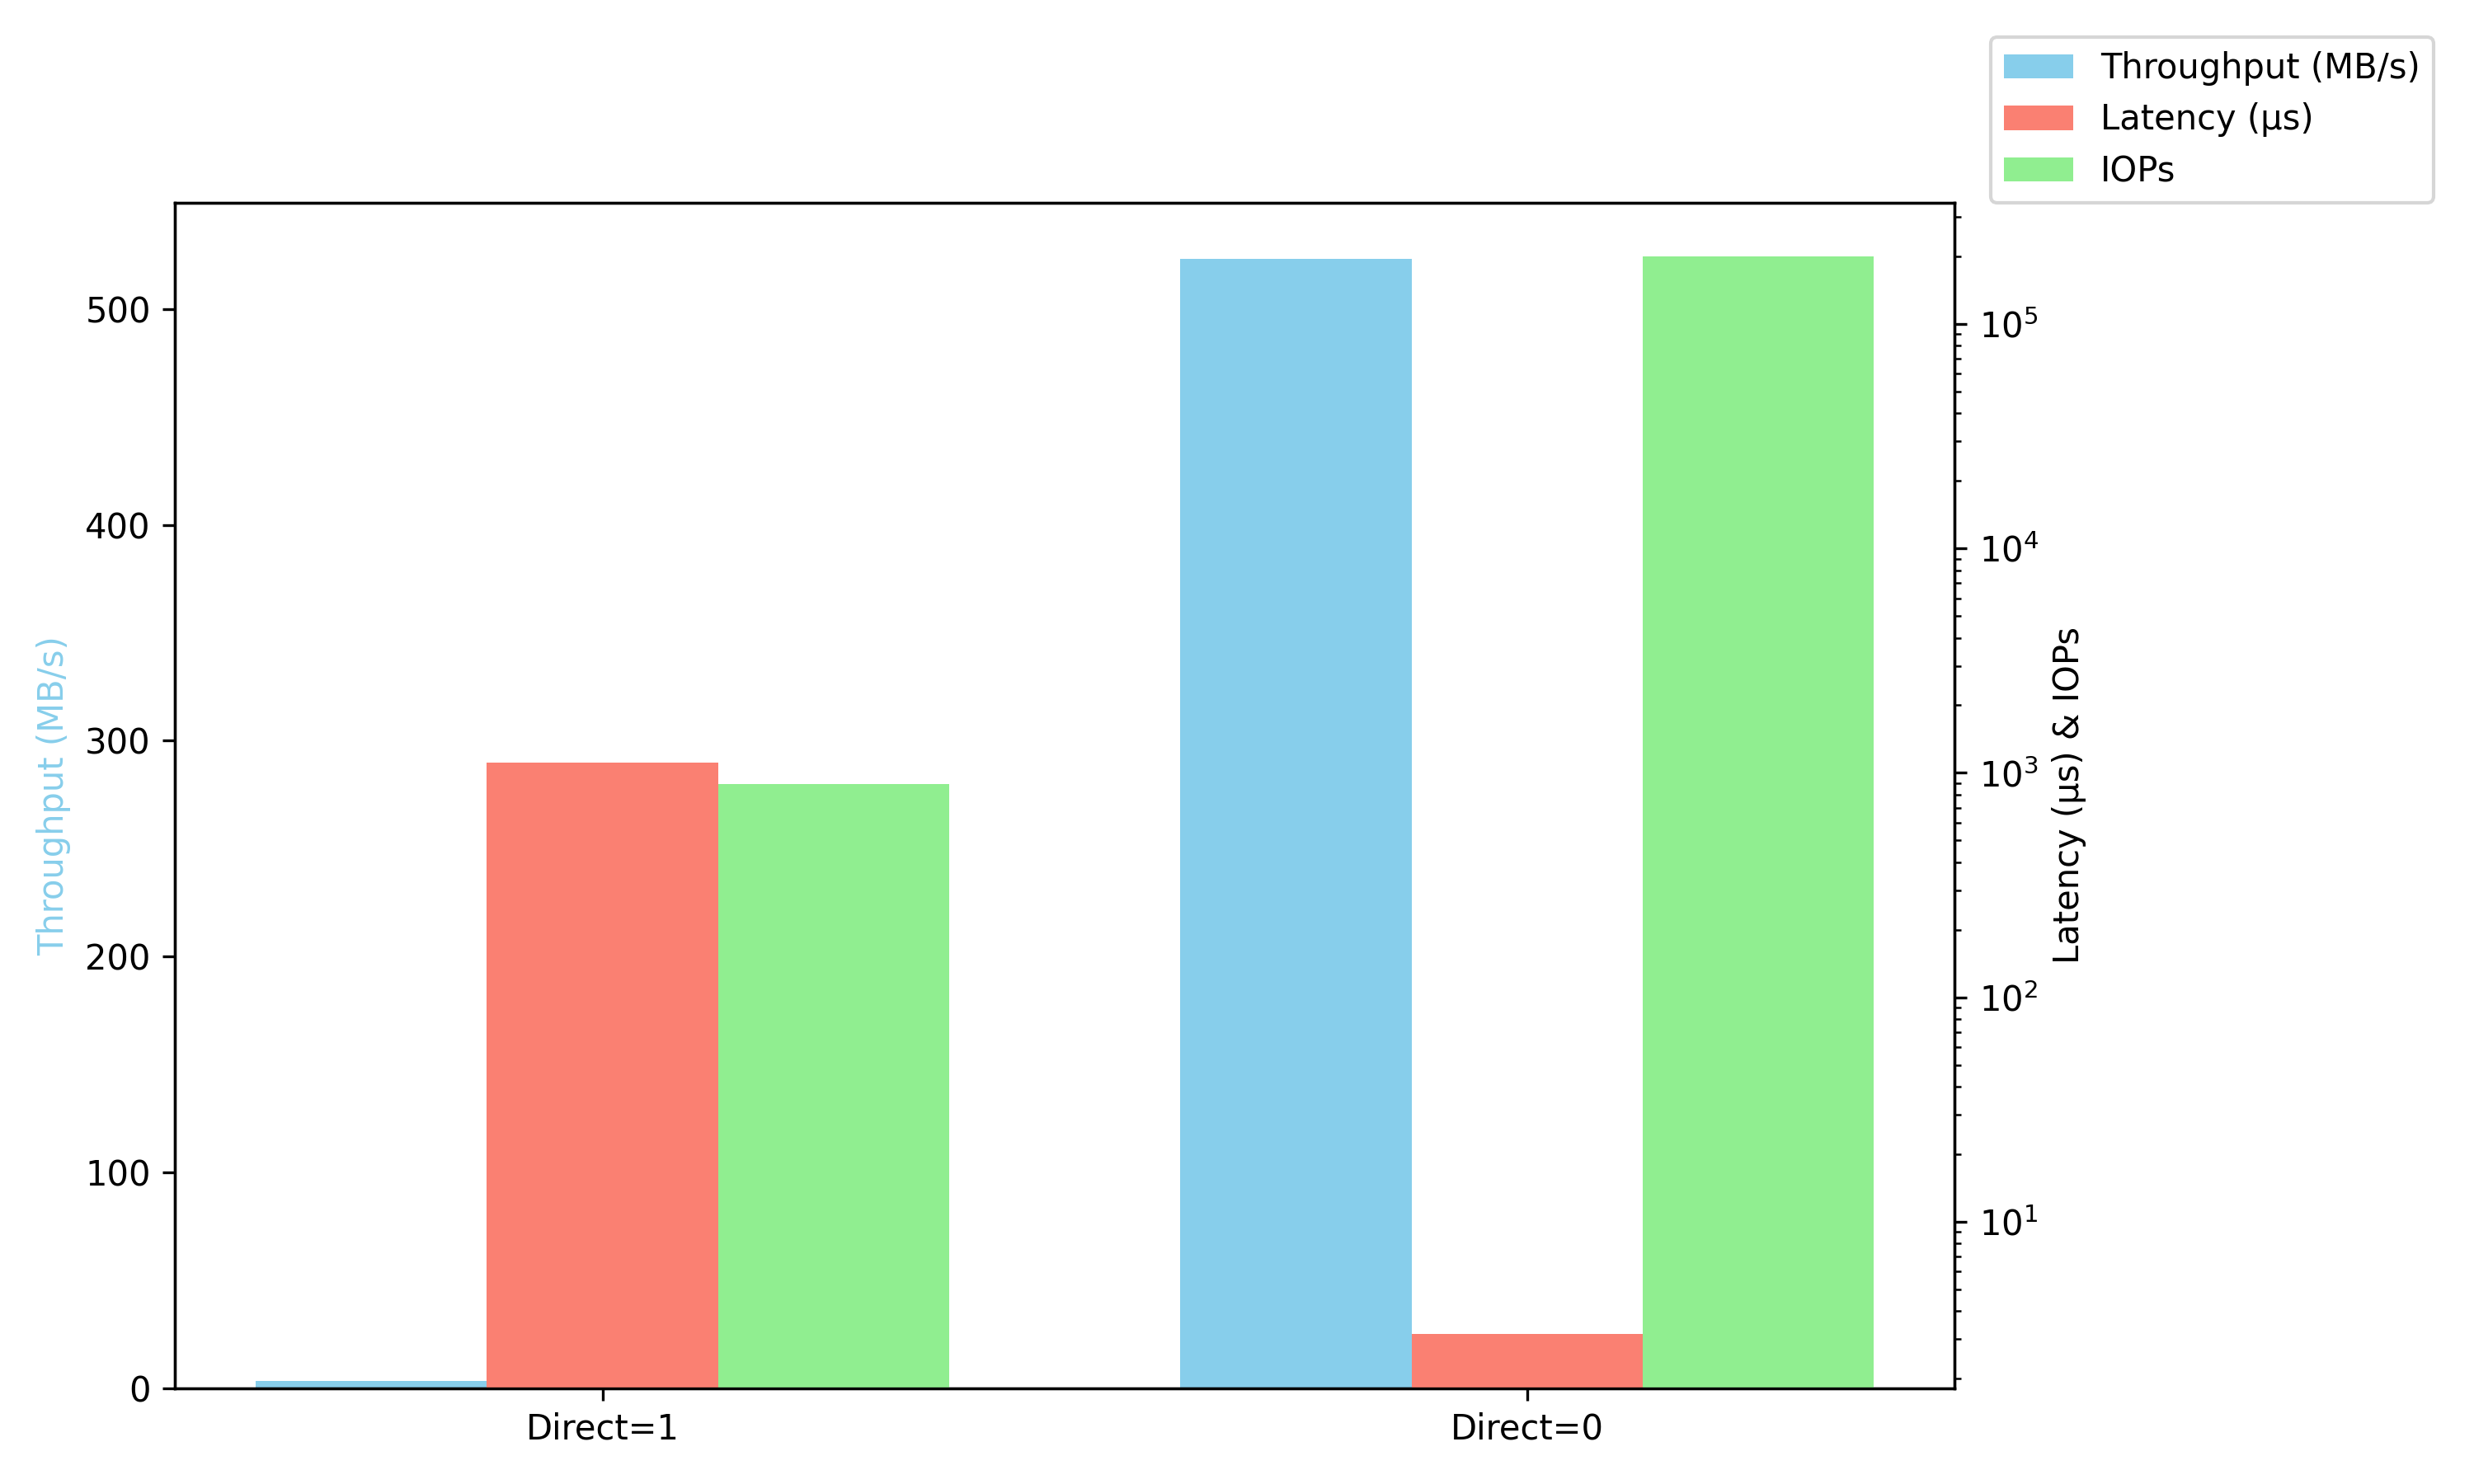
Direct I/O performs so badly that we can barely see the throughput. We could’ve done some normalization and log scaling, but the point was to show the real drastic difference between the two.
Then again, seeing the results from the non-direct I/O, they are just too good to be true. This is the tricky part when
it comes to benchmarking, knowing what results actually make sense, which ones are
realistic, and which ones aren’t. Setting direct=0 will throw you off and you’d end up testing a completely different
scenario (in this case, the RAM).
Testing Other Operations
Testing for other rw options is straightforward with FIO, we just need to change read to any of the supported
options:
writerwrandreadrandwrite
The base command remains the same. So if we want to test our write performance, the command would be adjusted as
such:
| |
And that’s it, we just had to change one parameter to test a completely different scenario. Which brings us to the next point, I/O testing can be, and is, very tricky because of that. A single parameter change would result in completely different outcomes and scenarios. So it’s important to carefully define what needs to be tested and which parameters to tinker with.
Conclusion
We’ve covered plenty of concepts and topics in this post, providing a solid foundation for running and interpreting fio benchmarks.
The key takeaway is that running a benchmark is only half the work. Understanding what you’re measuring and why is just as important. Small parameter changes can lead to vastly different results, and some trial and error is needed when defining realistic workloads. In the end, benchmark results are only meaningful if the workload matches reality.
In the next post, we’ll take this a step further by automating fio runs and diving deeper into the JSON output, including how to parse and analyze results at scale.