Introduction
In the previous post, we have covered how to deploy Node Exporter using our custom-built Ansible role. Node Exporter is only the first piece of the puzzle in building a monitoring stack solution. The next critical component in the monitoring stack is Prometheus.
By default, Prometheus uses local storage for persisting metrics data. These metrics are stored in a built-in Time Series Database (TSDB). Prometheus also supports integration with various remote storage solutions. For this post, we will focus on local storage and use a Docker volume to persist metrics data even when the container is restarted.
By the end of this post, you will have:
- A reusable Prometheus Ansible role
- Persistent metrics storage using Docker volumes
- Automatic discovery of Node Exporter targets
Prerequisites
For the demo in this post to work, you need to have:
- One or more target VMs
- Node Exporter must be preconfigured and set up
- Docker to be installed and available on the Prometheus server
community.dockerto be installed
Architecture Overview
We will first look at the architecture, then move on to implementation.
- Ansible host that runs the deployment
- Target VMs that have Node Exporter installed and running as a
systemdservice - A Prometheus host configured to monitor the target VMs
Prometheus follows a pull-based model, periodically scraping metrics from configured targets. The diagram below illustrates the setup:

Prometheus
Prometheus can be installed directly on the host or deployed as a container. By now, it’s recommended to use containerized deployments, and this is what we will be doing. Our Prometheus Ansible role will be broken down into two main phases:
- Prepare: Create the directories, render the Prometheus configuration template and create the Docker volume
- Deploy: Pull, run the image and mount the created volume onto the container
Core Variables
Just as in the Node Exporter, we will utilize variables to make our role flexible and adaptable without changing the internal implementation. The main variables are:
| |
We mount the configuration as read-only (/etc/prometheus:ro) to prevent accidental modification from inside the container.
Preparation
Our focus for this phase is:
- Creating config directories, which we will later bind-mount into the container
- Render the Prometheus configuration template
- Create the Docker volume, which will store Prometheus’ TSDB
| |
Prometheus Config Jinja Template
We will be using the following templates/prometheus.yml.j2 template:
| |
There are two scrape configs:
- Prometheus, allowing it to expose and monitor its own internal metrics
nodesor the target VMs.
The targets are dynamically generated as we loop over the inventory groups['targets'] and we set the metrics
endpoint. The metrics endpoint has the format of <ansible_host>:<node_exporter_port>. Each target exposes its metrics
via an HTTP endpoint (typically /metrics), which Prometheus periodically scrapes. This is defined in the
configuration file via metrics_path: "/metrics".
Below is an example of a rendered prometheus.yml template:
| |
Rendering of the hosts depends on how
ansible_hostis defined in your inventory. Onlocalhost, this will be resolved to127.0.0.1
Deployment
The deployment phase consists of two steps:
- Pulling the Docker image
- Running the container with the volume and bind-mounts included
This can be done using these two tasks:
| |
Main.yml
The role ties the phases together in tasks/main.yml:
| |
This completes our Prometheus role.
Example Playbook
The final step is to actually use our role and run it on our Prometheus host. To do that, we will create
playbooks/prometheus.yml:
| |
Then we run our playbook using the command:
| |
Localhost Deployment
You can perform a safe, local deployment in case you do not have a remote host:
| |
Since we’re running on localhost, we don’t need to explicitly specify an inventory file. So we can run our playbook
directly:
| |
You can now access Prometheus from the browser at 127.0.0.1:9090
Verification
Once the playbook finishes execution, we can verify Prometheus is up and running by:
- Checking running containers:
| |
- Querying the endpoint
| |
If all goes well, you should get Prometheus Server is Healthy. as an output.
We can also create a dedicated Ansible task for performing the verification for us, making it more suitable for a production environment.
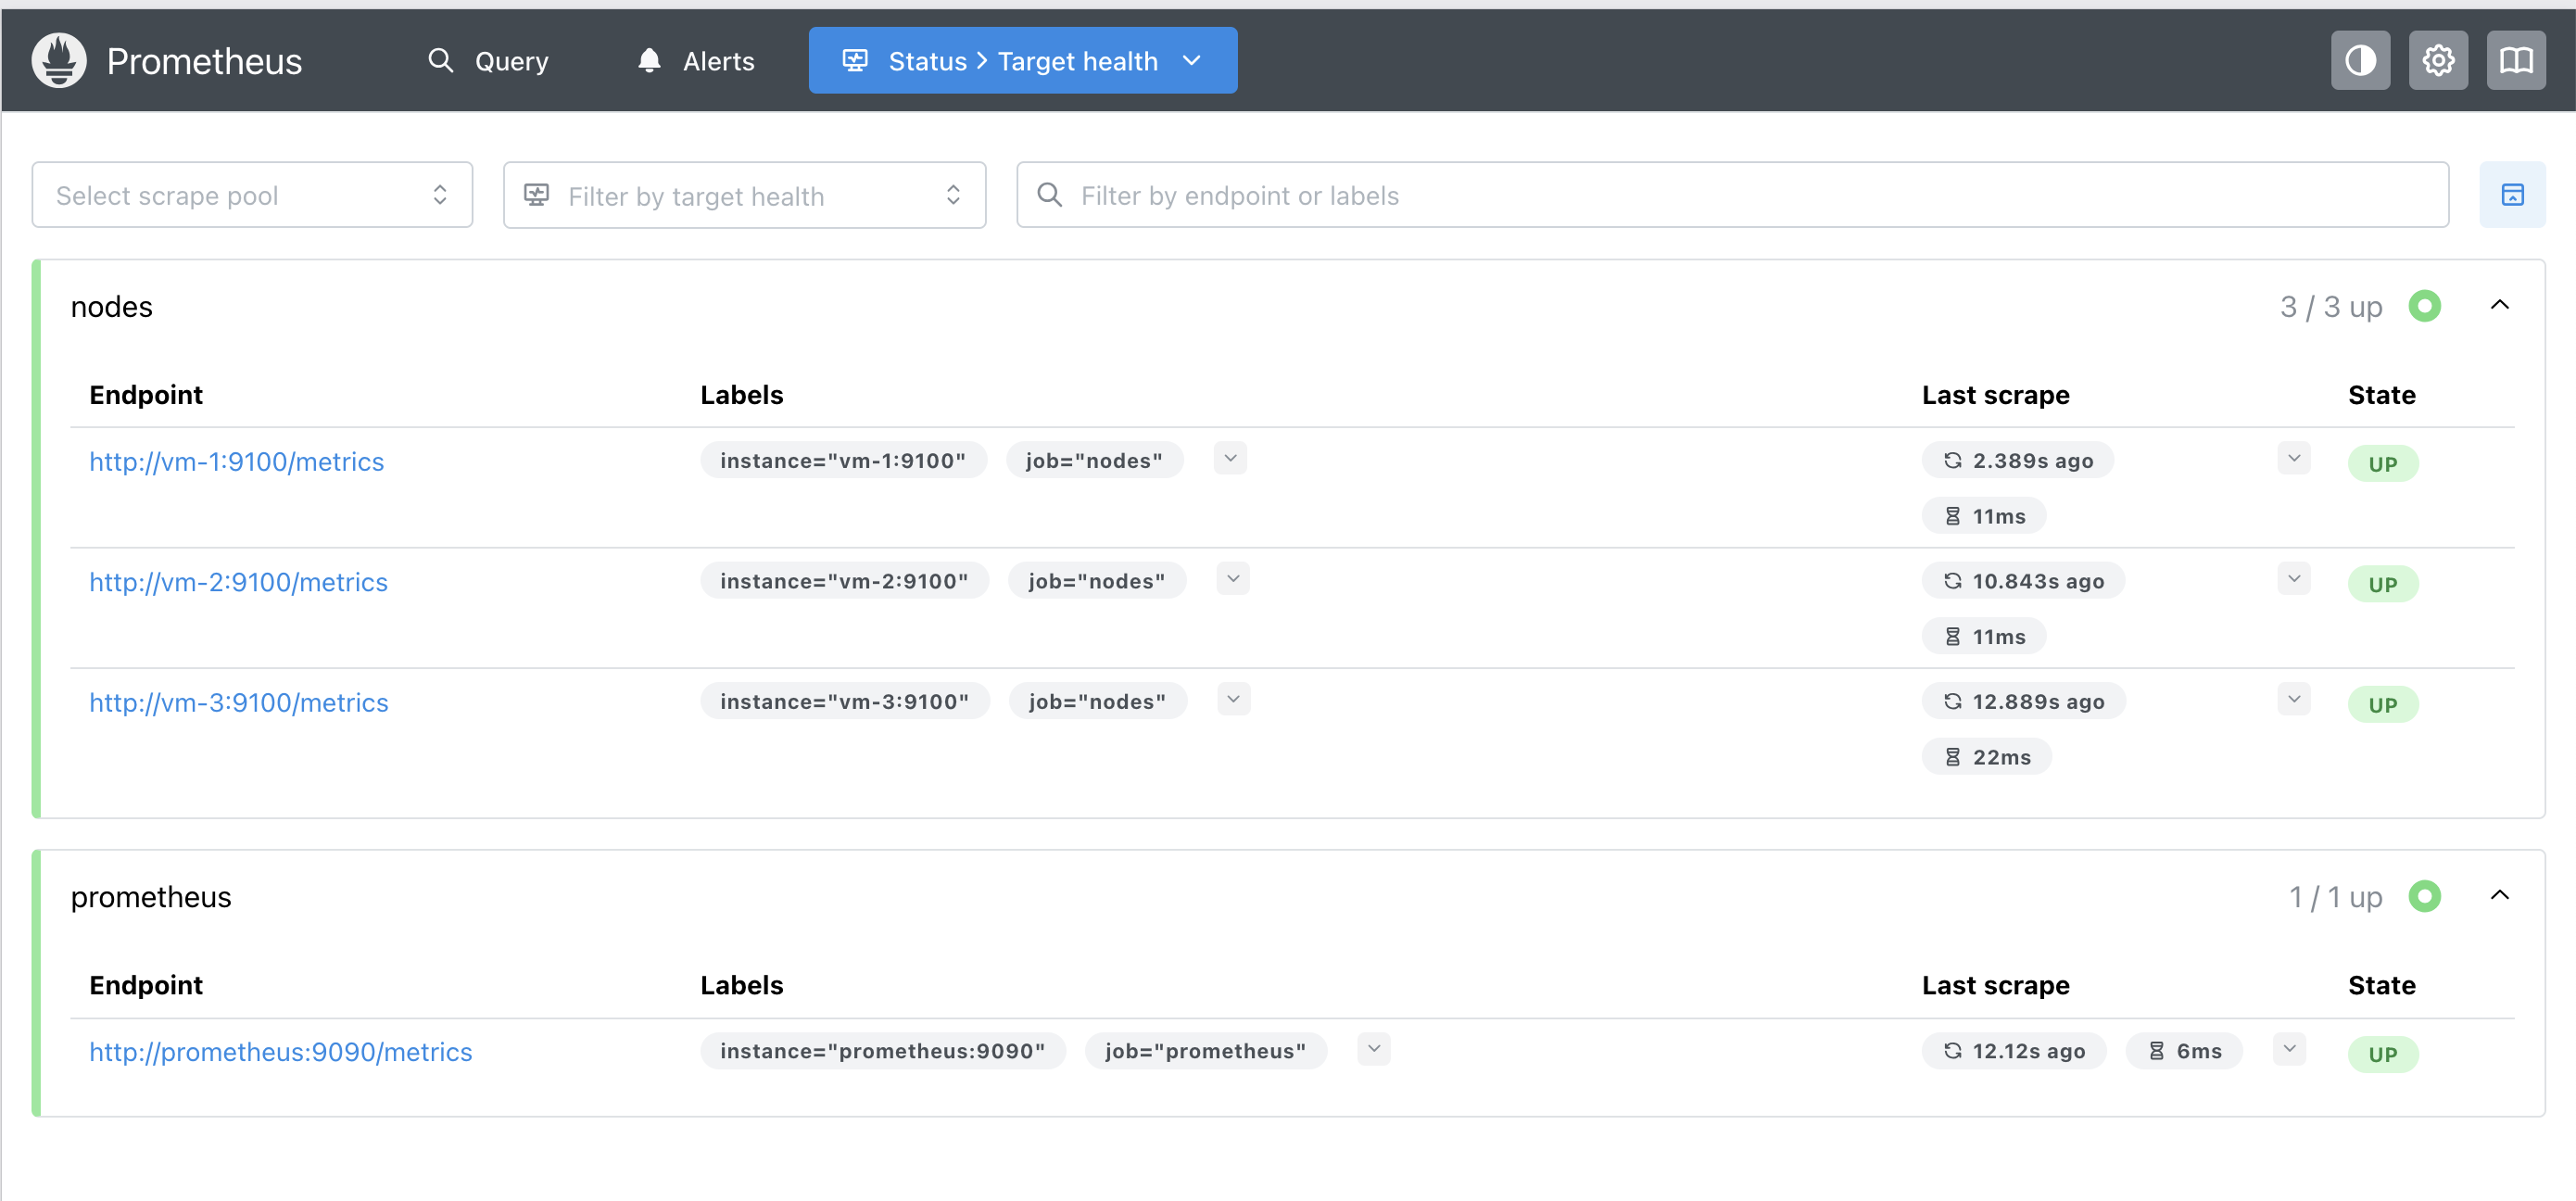
We can also access the dashboard from our browser and verify that our targets are being monitored:
Conclusion
In this post, we built a reusable Ansible role for deploying Prometheus as a Docker container. By structuring the role into clear phases and driving it through variables, we ensure maintainability and consistency across environments. The role is also written to be easily adjustable by modifying variables without changing the internal implementation.
The complete source code for this post can be found on GitHub.
By now, we have Node Exporter installed on the target hosts and Prometheus pulling the metrics. The next step is to visualize and explore these metrics using Grafana.