Introduction
In the previous blog
posts part 1
and part
2, we have Node Exporter
and Prometheus set up. We can already monitor our VMs and get valuable information.
However, running PromQL queries repeatedly is not practical for day-to-day monitoring or visualization.
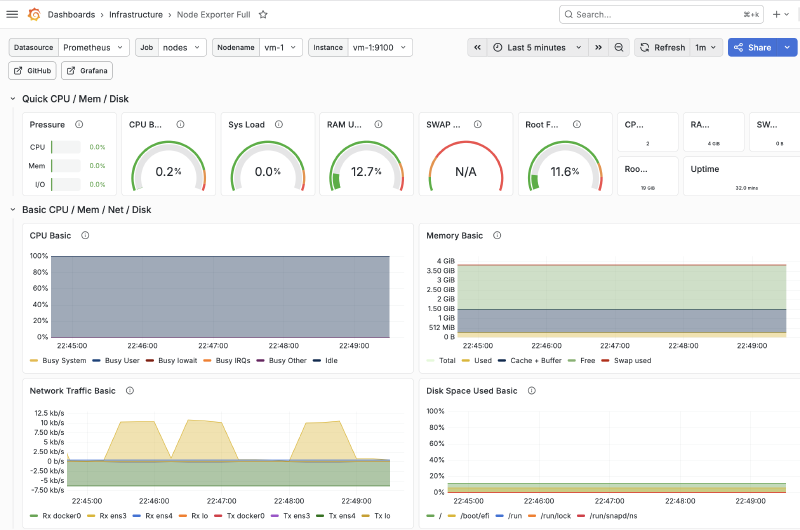
For that, we will deploy Grafana and import a pre-built dashboard so that we can visualize the scraped metrics. By the end of this post, we will have:
- A reusable Grafana Ansible role
- Provisioning of the data source and dashboards
- Docker volume for persisting the Grafana data
Prerequisites
For the demo in this post to work, you need to have:
- One or more target VMs
- Node Exporter must be preconfigured and set up
- Docker to be installed and available on the Prometheus server
community.dockerto be installed- An existing Prometheus instance
Architecture Overview
For simplicity, we are going to focus only on Grafana and its immediate components:

- A dedicated host for Grafana with an internal IP
- Grafana runs as a Docker container and exposes the port
3000 - A Docker volume will mount onto the container for persisting grafana-related data
Once all is done, we will have the full architecture setup:

Grafana
Similar to Prometheus, Grafana can be installed directly on the host or deployed as a container. At this point, it is clear that we will deploy Grafana as a container. The Ansible role will be broken down into two phases:
- Prepare: Create the directories, render the configuration template and create the Docker volume
- Deploy: Pull, run the image and mount the created volume onto the container
Variables
The variables for this role will be split into five categories:
- Paths and provisioning
- Prometheus integration
- Container integration
- Storage and volumes
- Endpoint
| |
Preparation
Our focus for this phase is:
- Creating config directories, which we will later bind-mount into the container
- Render the data source and dashboard provisioning templates
- Create the Docker volume, which will persist Grafana’s internal state (database, users, plugins). Dashboards and data sources will be provisioned via bind mounts
Dashboard Template
We define the dashboard provider template in templates/dashboards.yml.j2:
| |
Prometheus Data Source Template
We define the template in templates/prometheus_datasource.yml.j2 so that we can pre-include our Prometheus data
source:
| |
Later in this series, we will further extend the template to include an Alert data source.
Deployment
The deployment phase consists of two steps:
- Pulling the Docker image
- Running the container with the volume and bind-mounts included
This can be done using these two tasks:
| |
Main.yml
The role ties the phases together in tasks/main.yml:
| |
This completes the Grafana role.
Example Playbook
The final step is to actually use our role and run it on our Prometheus host. To do that, we will create
playbooks/grafana.yml:
| |
Then we run our playbook using the command:
| |
Localhost Deployment
You can perform a safe, local deployment for testing purposes:
| |
Then we can run the playbook using the command:
| |
You can now access Grafana from the browser at 127.0.0.1:3000 with the default credentials:
| |
Verification
Once the playbook finishes execution, we can verify Grafana is up and running by:
- Checking running containers:
| |
- Querying the endpoint
| |
If all goes well, you should get:
| |
We can also create a dedicated Ansible task for performing the verification for us, making it more suitable for a production environment.
Conclusion
In this post, we built a reusable Ansible role for deploying Grafana as a Docker container while also provisioning the data sources and Node Exporter Full dashboard.
The complete source code for this post can be found on GitHub.
So far, we have a basic monitoring stack setup that can be easily deployed on demand. But we are still missing a few key components to transform it into a more production-level solution. One of these critical components is Alerts, and that will be covered in the next post.